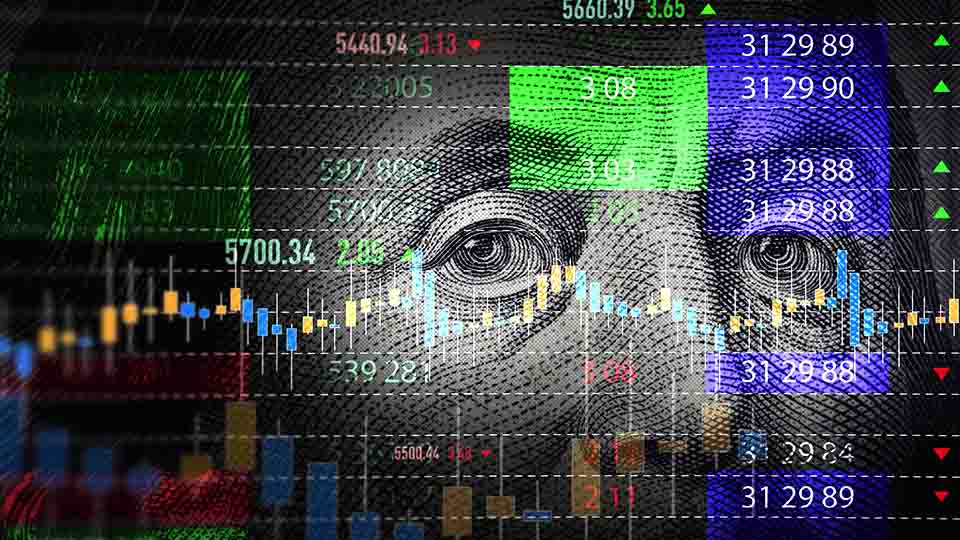
Stay Diversified and Stay Short
13 August 2024
Watch Time 11:22 MIN
This commentary may contain forward-looking statements, which reflect our current views on market and economic conditions. These are subject to change without notice and actual results may differ. Past performance is not indicative of future results. References to specific securities are for illustrative purposes only and do not constitute a recommendation to buy, sell, or hold securities. The information provided should not be considered as a comprehensive analysis of any company and investors should perform their own due diligence.
CEO Jan van Eck highlights three macro factors investors should be paying attention to as well as the investment implications of these observations. Learn More.
This is a marketing communication. Please refer to the Prospectus of the funds and to the KIDs before making any final investment decisions.
Hello and thanks for listening to our video this morning. My name is Jan van Eck. I'm the CEO of VanEck, and we will take the next couple of minutes just to look at the financial markets in our macro perspective. What are the big moving pieces to the markets that investors should be aware of?
Stay Diversified and Stay Short
First of all, actually, the US equity market—even though we should be in a good mood because the S&P was up 15 .5% in the first half of 2024—is notably very distorted. And we'll go through some of those slides that investors should absolutely know about.
Secondly, I've been talking about what I call the 2025 fiscal reckoning—the government spending and budget tightening I think that we're going to have to be doing after the presidential election and after everyone's in office.
And then talking about just the global growth situation, which is much better, became much better in the first half of 2024.
So first of all, this is a very unnerving slide. So this shows the performance of large cap growth against large cap value over several decades. We know that growth peaked in what they call the internet bubble of 1999. But so far this year, you can see growth again after having a great 2021 has rallied dramatically against value and has reached the kinds of distortions that we saw during the internet bubble. So that is one multi-year perspective.
This table is also helpful in looking at how one can have different eras of performance and different kinds of performance within different types of stocks. So let's say where we are now. It all feels really good. The S&P market cap index is performing because mega cap tech is a huge weighting in the S&P market cap index and it has been leading the performance. And NVIDIA, which I'll talk about in a second, is one of the leaders there, which is the chip manufacturer.
What's interesting to see is not surprisingly during the last era since 2014, NASDAQ has been leading the way—again, technology, then the S&P market cap, but lagging quite a bit in equal weight S&P index, which means sort of one could say the average large cap stock is up a lot less.
And then far behind are small caps, international stocks and emerging markets stocks.
What's interesting is, if you look at the era of the 2000s, the second column, it's almost entirely reversed. You had emerging markets and international equities outperforming an equal weight, dramatically outperforming the S&P over that time period. So it kind of shows that if you started a period where growth was very overvalued, even though these tech companies are growing, the stock market returns that they give you are very different.
The last column, the 1996 to 2000 tech run-up era, you can see from the numbers. are very similar to recent performance.
So let's drill down on one stock in particular, which is Nvidia. So this shows the forward price-to-earnings ratio of Nvidia. So the next four quarters is about trading at 33 times earnings. That means it'll take 33 years of profits to get your money back if you buy a share of Nvidia today.
Now, of course, this just prices in the fact that they're expecting Nvidia to grow. But with Nvidia being such a big multi-trillion dollar company now, I just think, again, the data does not jump out at you. It's really the multi-year data. So we do know that these kinds of companies are more solid in terms of sales growth and profitability – and I'm talking about Apple and Google and all those companies as well – than during the tech bubble of, or the internet bubble of 1999. But still these are very, very rich valuation numbers. Past performance is not indicative of future results.
If we have a hiccup in tech, and semiconductors in particular, which could be shrinking margins, it could be a slowdown in demand, not a crash, a slowdown in demand, or some kind of risk around the supply chain in Taiwan. All of those things would leave these stocks pretty vulnerable and we've seen what kind of returns you can get if that happens. All right, so that's the distortions of growth versus value.
Let's get to the second topic, which is the budget deficit. This chart, the solid blue lines just shows that the federal budget deficit is at almost all-time highs and is certainly very high given the low unemployment rate right now.
And I think that basically the boom in government spending is causing us to feel so good. It's causing stocks to go up. It means that the consumer has a lot of money, relatively speaking. It means that corporate America has low levels of debt, relatively speaking. It also, I think, explains why inflation has stayed higher than many people expected and also explains why the Fed hasn't been easing. So all of those are things that we have been talking about over the last year or two. Not surprising to us. And then I list some indicators in the market, high Bitcoin and gold prices. I'll just mention one that I think reflects this uncertainty about US government spending.
So let's briefly look at where the candidates stand. You can see what happened during the Trump administration, and I'm going to say Harris, although we won't know that for several weeks.
So first of all, Trump lowered the corporate taxes to 21% to make America more competitive as a manufacturing base. We know that there should continue to be wage pressure if he gets elected with support in Congress. And that's why I added that to the title slide, because if you have a split government, it's hard to do any major initiatives. And I just list his spending during his administration.
So now turning to Kamala Harris and let's say again with the level of congressional support, what happened during the Biden administration. There was about $3T worth of extra spending, $800B in the Inflation Reduction Act, $280B on the CHIPS Act and $2T in the 2021 American Rescue Plan. So a lot of excess spending, too, which has driven this federal deficit.
We don't know a ton about what their plans are, but they've been a little bit more revealing than Trump/Vance so far. They've said that they would consider a wealth tax on individuals with $100M or more of income. That's never happened before in US history, and it's hard to implement, but it's more taxes.
And then they've explicitly said that they would raise Medicare taxes from 3.8% to 5%. Of course, that's doubled when you look at the employer contribution. And that's for employees with income over $400,000. They've also are trying to cut drug prices. They don't have an explicit solution to the Social Security problem.
So both candidates have spent a lot of money. Arguably, if Congress is split and there's no big government spending, they should be able to just go through without major changes.
The discussion herein regarding political candidates and their potential policies is based on current information and analysis. These views do not reflect any endorsement or opposition by VanEck or its affiliates. The potential impacts of political changes are inherently uncertain, and investors should consider these factors as part of a broader framework in their investment decision-making process.
But if you look at the next slide, that is simply not possible. And the reason is because of Medicare and Social Security deficits looming, you can see under these different colored scenarios that the debt will grow in the US either crazy, almost crazy or still very high. So I think they need to bend the curve on this, and that's why I think there's going to be pressure.
I think this is why we see that the Fed has been reluctant to cut interest rates. I think they wanted to get through all that COVID spending and the monetary policies that facilitate it as well. If they do cut interest rates, unless there's severe economic contraction, I don't see a big fall in rates. So that's where we are now. Time will tell. Base case, the government will have to increase taxes or cut spending in some combination, and the Fed will cut rates to stimulate that. So not horrible for the stock and bond markets. But there is this risk of the 10-year interest rates spiking higher because the government doesn't end up solving those problems.
I've pointed this out before, but global growth as measured by this, which is the Purchasing Managers’ Index, has turned solidly positive at the beginning of 2024.
My interpretation of this is that the world economy is chugging along okay. Europe is turning around a little bit. The US continues to grow at a slower rate. There are some growth engines like India that are really, really growing at a high rate. Not big enough to matter, but they will. And I am feeling, even though recent Chinese growth statistics have been weak, that they are closer to the end of dealing with their property problems than the beginning. So I don't see China as hugely supportive of global growth, but I think the rest of Asia is carrying along the world, and that's why this trend is pulling up.
This is basically positive for commodities demand, and we saw that in the second quarter of this year when commodity prices started rallying.
So let's just summarize the three points.
Number one, the stock market was very distorted at the end of the second quarter with growth outperforming value by a dramatic amount in historical context. We see that stocks like Nvidia aren't off the charts in their valuations, but still distorted if you take the lens out from a multi-year perspective.
Secondly, we see that government spending is at very high levels. We don't know how they’re going to deal with it, but it really seems like they're going to have to deal with it after the presidential election.
And then thirdly, you see global growth picking up.
So what are the investor takeaways from these observations?
Number one, if you're in equities, make sure that you're not overexposed to the S&P 500 market cap index. Own equal weight large cap, own mid caps, own small caps, own international. Be diversified in your equity portfolio.
At the end of 2021, I said growth was so overvalued, one should get out. I don't feel that strongly, but I definitely feel like it's important and then some signals are being sent to rebalance your equity portfolios, number one.
Number two, on the fiscal spending side for your fixed income, it should be fine. There's a small risk of a spike in long-term interest rates. So why bother take that risk when you're getting paid high interest rates on the short term? So that's where I continue to stay.
And then lastly, we see that global growth is picking up. This is good for commodities. And one could say, I'm not quite set there, but that we, over last several weeks of the beginning of July and the end of June of 2024, could be entering a regime change. That is not impossible to imagine.
Thank you for listening.
Important Disclosure
For informational and advertising purposes only.
The information contained in this video is intended only to provide general and preliminary information to investors. It shall not be construed as promotion of a specific product nor as investment, legal or tax advice. VanEck assumes no liability with regards to any investment, divestment or retention decision taken by the investor on the basis of this information. Opinions are current as of the publication date and are subject to change with market conditions. Certain statements contained herein may constitute projections, forecasts and other forward looking statements, which do not reflect actual results. Information provided by third party sources are believed to be reliable and have not been independently verified for accuracy or completeness and cannot be guaranteed.
All performance information is historical and is no guarantee of future results. Investing is subject to risk, including the possible loss of principal. You must read the Prospectus and KIID/KID before investing. These and further information about VanEck are available at www.vaneck.com.
No part of this material may be reproduced in any form, or referred to in any other publication, without express written permission of VanEck.
© VanEck