Sustainable Investing
Insights on aligning positive sustainability outcomes alongside financial results with a heightened focus on the trends, themes, and tailwinds as the structural changes across resources, commodities, and technology converge.
EDUCATION
VanEck’s sustainability-related solutions incorporate many of the UN’s Sustainable Development Goals, thus enabling investors to choose investments that reflect their values and concerns.
CEO Jan van Eck discusses the firm’s perspective on, and commitment to, responsible investment in 2024.
We remain committed to responsible investment and seek to incorporate factors, commonly referred to as environmental, social and governance, in our active investment analysis and engagement activities.
EDUCATION
Frequently Asked Questions
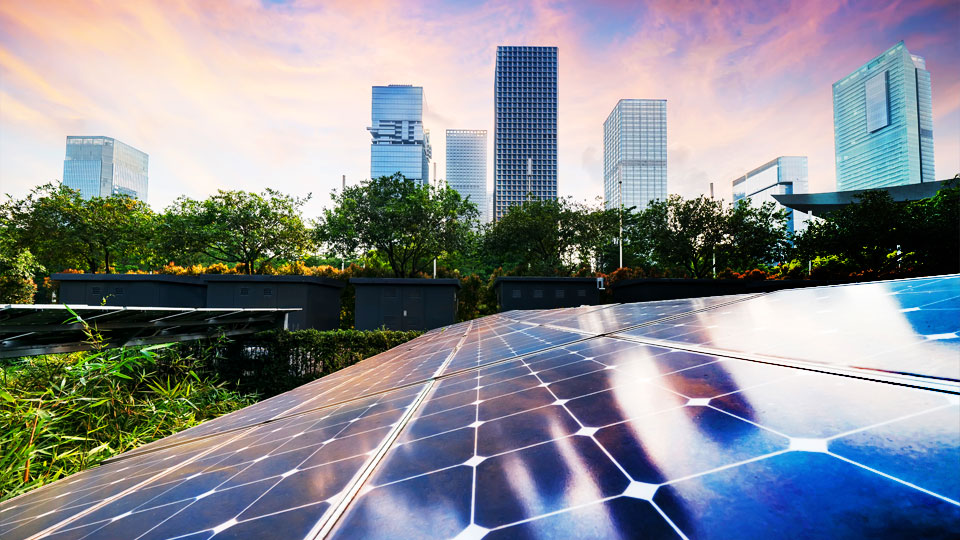
Low carbon energy companies have evolved and are proving extremely innovative as they tackle some of society’s most difficult challenges. We explore in this Q&A.
The transition from traditional to sustainable infrastructure is creating opportunities for investors. We explore in this Q&A.
Green bonds can help investors build sustainable core fixed income portfolios without significantly impacting risk and return.
Related Funds
_ of _
SMOG
VanEck Low Carbon Energy ETF
Comprehensive exposure to the broad range of technologies and investment opportunities in the low carbon energy ecosystem
GRNB
VanEck Green Bond ETF
Access to green bonds, which directly finance projects that have a positive impact on the environment
GMET
VanEck Green Metals ETF
Metals critical to the energy transition from fossil fuels to cleaner energy sources and technologies
RNEW
VanEck Green Infrastructure ETF
Exposure to U.S. companies with revenues primarily generated from sustainable infrastructure businesses
THOUGHT LEADERS
Insights from the firm’s leading thinkers on today’s most interesting investment topics.
1 - 2 of 3