ROC & Rolling
March 05, 2020
Read Time 2 MIN
After years of investment spent predominantly on growth, companies in the exploration and production (E&P) sector have shifted their business models to focus on generating sustainable returns of capital (ROC). These returns are increasingly being delivered back to shareholders in the form of dividends and share repurchases. Although still early in the transition, returns of capital so far have demonstrated a commitment to this approach by management teams in the industry.
Over the last 10 years, the development of domestic shale oil resources by the U.S. independent E&P sector has transformed the global crude market, helping to stifle inflation and deliver an indelible stimulus to the global economy. U.S. crude oil production more than doubled in the last decade, reaching over 13 million barrels per day (b/d), making the U.S. the largest producer of crude oil in the world.
This burgeoning output satiated record worldwide demand growth, which hit a historical high of over 102 million b/d in the fourth quarter of 2019. Over this time period, oil prices have fallen from $80-$100/barrel in the early part of the decade to $45-$65/barrel in recent years. Almost all of this incremental supply derived from increased shale oil production in the U.S., where independent E&P companies harnessed innovative and rapidly developing technologies to tap into shale oil reserves that were previously known but challenging and expensive to exploit.
As the business model required to deliver this massive supply growth inflects from one of immense upfront capital investment to one where scale and critical mass generate returns on that investment, increasingly the companies are delivering those returns to shareholders in the form of competitive dividends and share repurchases. In fact, the SPDR S&P Oil & Gas Exploration & Production ETF (XOP) now has a dividend yield over 2%, in excess of the S&P 500. Importantly, this new business model appears to be in its early stages and companies are delivering striking returns of capital despite the headwinds facing the industry.
Fourth quarter earnings have been positive for the E&P sector as financial results show continued step change improvements on returns of capital to shareholders by announcing an increase in dividends and continued share repurchases. Management teams have taken what we believe are the right steps to prove that companies can offer sustainable cash generation. This commitment to harvesting of cash flows are at the inflection point and the industries are progressing toward competitive yields not only relative within their sector, but also against other sectors in the broader market.
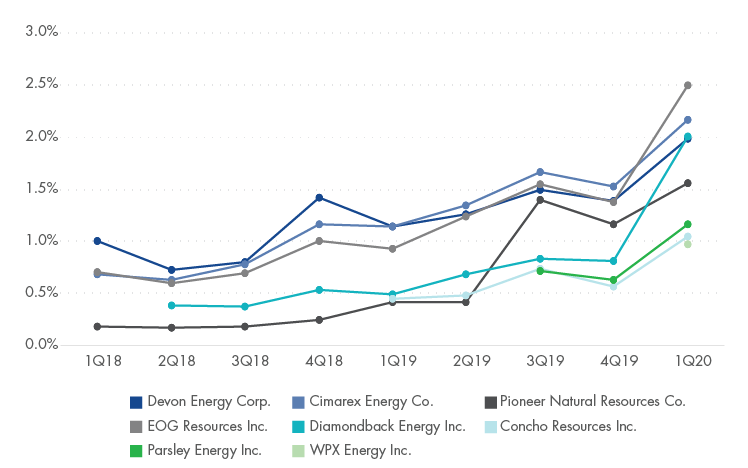
The charts below show dividend growth from eight E&P companies that reported over the last two weeks. The most recent quarter shows a big step change in dividends for these eight companies.
E&P Companies Have Ramped Up Returns to Shareholders
Quarterly Dividend per Share (1Q 2018 to 1Q 2020)

Quarterly Dividend Yield (1Q 2018 to 1Q 2020)

Source: Company Reports, Bloomberg. Data as of February 2020. From 1Q 2018 to 4Q2019, calculations were based on quarter-end closing price and for 1Q 2020, the pre-earnings closing price was used. For Pioneer Natural Resources, pre-2Q19 paid semi-annual dividends have been converted to quarterly for this chart. WPX Energy Inc. announced planned dividends in February 2020 with the first payment is planned for third-quarter 2020.
DISCLOSURES
Please note that the information herein represents the opinion of the author, but not necessarily those of VanEck, and this opinion may change at any time and from time to time. Non-VanEck proprietary information contained herein has been obtained from sources believed to be reliable, but not guaranteed. Not intended to be a forecast of future events, a guarantee of future results or investment advice. Historical performance is not indicative of future results. Current data may differ from data quoted. Any graphs shown herein are for illustrative purposes only. No part of this material may be reproduced in any form, or referred to in any other publication, without express written permission of VanEck.
Please note that Van Eck Securities Corporation (an affiliated broker-dealer of Van Eck Associates Corporation) offers investments products that invest in the securities included in this commentary.
The information presented does not involve the rendering of personalized investment, financial, legal, or tax advice. Certain statements contained herein may constitute projections, forecasts and other forward looking statements, which do not reflect actual results. Information provided by third-party sources are believed to be reliable and have not been independently verified for accuracy or completeness and cannot be guaranteed. Any opinions, projections, forecasts, and forward-looking statements presented herein are valid as of the date of this communication and are subject to change without notice. The information herein represents the opinion of the author(s), but not necessarily those of VanEck.
The views contained herein are not to be taken as advice or a recommendation to buy or sell any investment in any jurisdiction, nor is it a commitment from Van Eck Associates Corporation or its subsidiaries to participate in any transactions in any companies mentioned herein. This content is published in the United States. Investors are subject to securities and tax regulations within their applicable jurisdictions that are not addressed herein.
All investing is subject to risk, including the possible loss of the money you invest. As with any investment strategy, there is no guarantee that investment objectives will be met and investors may lose money. Diversification does not ensure a profit or protect against a loss in a declining market. Past performance is no guarantee of future results.