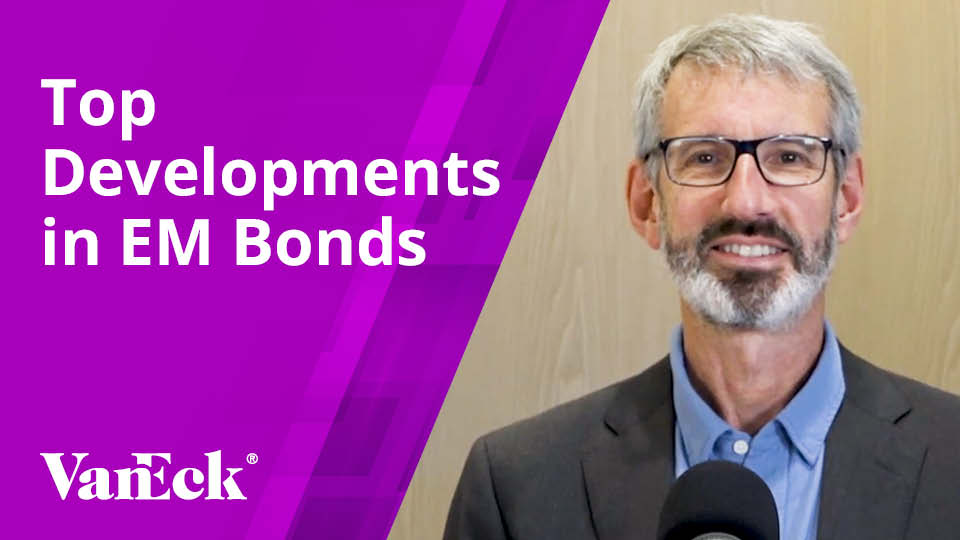
Technical and Fundamental Factors Paint a Rosy Picture
12 February 2024
Read Time 2 MIN
Emerging markets (EM) debt, in various forms, posted admirable returns in 2023. The most commonly cited form – US dollar denominated sovereign debt – benefited from the late year rate rally and posted a total return of +11.1% for the year. That was more than 550 basis points (bps) better than US aggregate investment grade bonds, 270 bps better than investment grade US corporates, and approximately 700 bps better than intermediate Treasuries. EM local currency sovereign bonds did even better than dollar-denominated sovereigns, outpacing the other asset classes listed above by an additional 160 bps, and without the benefit of a sustained EM currency rally. EM US dollar denominated corporate bonds did not fare as well as sovereigns overall, and both the investment grade and high yield components lagged their US corporate counterparts, but both still enhanced returns as satellite additions to core bond allocations.1
Given the higher yields available in EM and, in aggregate, stronger debt fundamentals versus DM counterparts, the overall outperformance in 2023 (and over the entire two-year period of 2022 and 2023) is not surprising2. What might be surprising is that EM debt funds suffered consistent outflows throughout both 2022 and 2023. Flows out of dedicated hard currency EM debt funds were $45 billion in 2022 and $25 billion in 2023, while dedicated local currency debt funds saw outflows of $45 billion in 2022 and $9.0 billion in 2023. At the same time, net supply of EM dollar denominated sovereign and corporate debt shrank as well. Net new issuance in EM dollar sovereigns was only $21 billion in 2023, after registering -$28.6 billion in 2022. For EM dollar denominated corporates the numbers were -$157 billion in 2023 and -$259 billion in 2022. As the EM debt universe continues to mature in a variety of ways, apparently another important development is that outperformance is no longer driven exclusively by “hot money” flows. In fact, 2023 appears to have been a year of outperformance that was also characterized by an improving technical picture.
EM Debt Dedicated Cumulative Flows (US$, bn)
Source: EPFR, Morgan Stanley Research.
Both US high yield and municipal bond asset classes also witnessed net outflows in 2023, but US Treasury and Aggregate funds experienced significant inflows, particularly into ETFs, representing the majority of some $220 billion that came into taxable bond funds. That number does not include money market funds, which took in nearly $1 trillion in 2023! We believe that the favorable technical picture, combined with the attractive fundamental profile of EM debt, sets the stage for another year of potential outperformance versus DM bonds. Investors who are under-allocated to the asset class may want to consider increasing their exposure within their global bond portfolio.
DISCLOSURES
1 EM hard currency sovereign bonds represented by the J.P. Morgan EMBI Global Diversified Index; EM local currency sovereign bonds represented by the J.P. Morgan GBI-EM Global Diversified Index; EM corporate bonds represented by the CEMBI Broad Diversified Index; aggregate investment grade bonds represented by the ICE BofA US Broad Market Index; US corporate bonds represented by the ICE BofA US Corporate Index; Intermediate treasuries represented by the ICE BofA 1-10 Year US Treasury Index; US high yield corporate bonds represented by the ICE BofA US High Yield Index.
2 Past performance is not guarantee of future results.
Important Disclosure
This is a marketing communication for professional investors only. Please refer to the UCITS prospectus and to the Key Investor Information Document (KIID) before making any final investment decisions.
This is a marketing communication for professional investors only. Please refer to the UCITS prospectus and to the Key Investor Information Document (KIID) before making any final investment decisions. This information originates from VanEck Securities UK Limited (FRN: 1002854), an Appointed Representative of Sturgeon Ventures LLP (FRN: 452811) which is authorised and regulated by the Financial Conduct Authority in the UK. The information is intended only to provide general and preliminary information to FCA regulated firms such as Independent Financial Advisors (IFAs) and Wealth Managers. Retail clients should not rely on any of the information provided and should seek assistance from an IFA for all investment guidance and advice. VanEck Securities UK Limited and its associated and affiliated companies (together “VanEck”) assume no liability with regards to any investment, divestment or retention decision taken by the investor on the basis of this information. The views and opinions expressed are those of the author(s) but not necessarily those of VanEck. Opinions are current as of the publication date and are subject to change with market conditions. Certain statements contained herein may constitute projections, forecasts and other forward-looking statements, which do not reflect actual results. Information provided by third party sources is believed to be reliable and have not been independently verified for accuracy or completeness and cannot be guaranteed. Brokerage or transaction fees may apply.
All performance information is based on historical data and does not predict future returns. Investing is subject to risk, including the possible loss of principal.
No part of this material may be reproduced in any form, or referred to in any other publication, without express written permission of VanEck.
© VanEck Securities UK Limited
Sign-up for our ETF newsletter
Related Insights
Related Insights
08 January 2025
06 August 2024
23 July 2024
16 April 2024
04 March 2024


