Gold Wavers Amid Market Euphoria
11 July 2023
Read Time 6 MIN
Monthly gold market and economic insights from Imaru Casanova, Portfolio Manager, featuring her unique views on mining and gold’s portfolio benefits.
Not the dollar this time…
Gold was down $43.38 per ounce or 2.2% for the month, closing at $1,919.35 on June 30. Two- and ten-year treasury yields climbed higher in June, but the U.S. dollar was not to be blamed for gold’s drop this time. The U.S. dollar index (DXY)1 was also down in June (-1.4%).
Instead, gold was pressured by the relentless strength of the U.S. equity markets, which were undeterred by the outlook for more rate hikes this year, or by the recession signals sent by the most deeply inverted treasury yield curve in decades. The S&P 5002 and the NASDAQ 1003 were both up more than 6.5% in June, posting double digit gains for the year with the tech-heavy NASDAQ up a whopping 39% in the first half of 2023. Apple closed the month at a milestone $3 trillion market cap, the world’s first company ever to reach such valuation.
A notable revision to first-quarter GDP annualized growth to 2% from 1.3%, along with other better-than-expected economic releases (e.g., U.S. May retail sales, housing starts, jobless claims, consumer sentiment), slowing inflation and comments from the U.S. Federal Reserve (Fed) chairman and Treasury Secretary downplaying the risk of a recession, likely fueled the optimism.
The NYSE Arca Gold Miners Index (GDMNTR)4 and the MVIS Global Juniors Gold Miners Index (MVGDXJTR)5 felt the pressure of a declining gold price, down 2.5% and 3.9% respectively during the month of June. Following what was a dreadful month for gold equities in May, we were pleased to see the equities performing much more in line with our expectations in June. We expect strong gold mining sector fundamentals in a year when average gold prices are at record highs ($1,934 in the first half of 2023), will lead to a progressive contraction of the valuation gap between the metal and the stocks.
Gold’s drivers still remain the same
Our outlook for higher gold prices in the longer term is unchanged, supported by the risks imposed by sustained elevated interest rates, sticky inflation, continued global geopolitical tensions, a trend by countries around the world to diversify away from the U.S. dollar and increase their gold reserves, and the pending risk of a U.S. and/or global economic recession. Investors continue to stay on the sidelines of the gold market. Global gold bullion ETF holdings, our proxy for investment demand, declined 1.64% during the month of June, leading to net outflows year-to-date of 1.21%.
Gold failed to hold above $1,950 per ounce. It may now trade sideways around the $1,900 level, until a new catalyst emerges. A Fed skip, signaling the nearing of the end of the tightening cycle, failed to provide impetus for gold and attract investors. But as the end of the hiking cycle approaches, the reasons for a pause (fear to launch the economy into a recession or into a deeper recession) and the implications on inflation, could become important gold price drivers.
SPECIAL – Walking on Gold: Junior Miners in the Alaska/Yukon Region
VanEck’s active gold strategy has always maintained a significant allocation to juniors. We divide our junior investments into producers, with mine production of up to 300,000 ounces per year, and developers, with properties under development that we believe can reach an economic reserve of at least two million ounces. We don’t invest in junior exploration stocks because we find them too speculative. While most explorers claim they’ve made a discovery, very few will ever meet our two-million-ounce threshold.
We often travel to exploration and development sites to help determine whether a property has the potential to meet our investment criterion. We recently spent time in the Yukon and Alaska to visit several promising projects in the Tintina Gold Province (yellow on map), where most of the gold deposits occur in and around Cretaceous (145 to 66 million years old) granitic intrusions scattered throughout the Tombstone Plutonic Belt (pink on map). The Tombstone Belt is about 70 miles wide and trends west-northwest through the Yukon. It is offset along the Tintina Fault, a major strike-slip fault that carried the western portion of the belt 300 miles to the northwest into Alaska during the Eocene Age (55.8 to 33.9 million years ago).
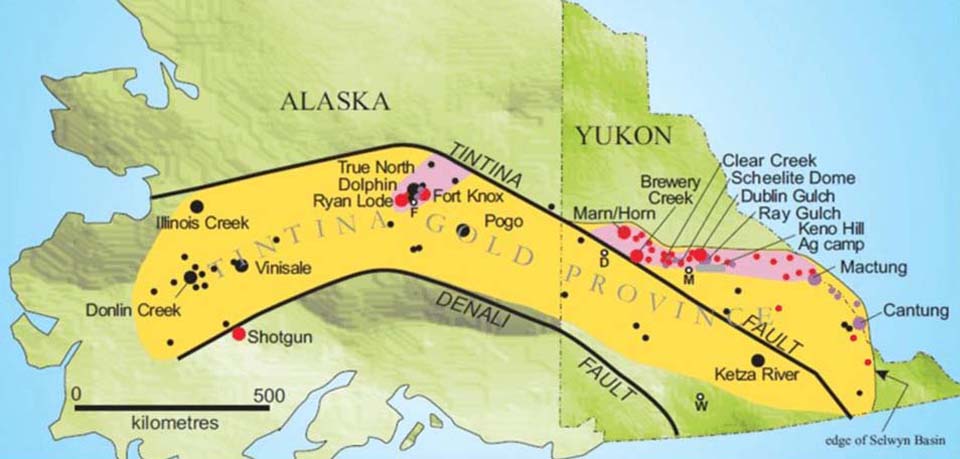
Map of Alaska’s Tintina Gold Province (yellow) and Tombstone Belt (pink). Source: Apex Geoscience Ltd. (May 2016).
Kinross’ Fort Knox mine is located in the Fairbanks gold district, Alaska in the western-most portion of the Tombstone Belt. Since 1996, Fort Knox has produced over 8 million ounces of gold from low-grade ores. We visited the Fairbanks district where Freegold Ventures (0.00% of Strategy net assets) is drilling its Golden Summit project. In February, Freegold announced a resource of 20.6 million ounces.i We also visited Banyan Gold’s (0.00% of Strategy net assets) AurMac property in the Mayo Gold district, Yukon. Banyan announced a 6.2-million-ounce resource in May.ii Both of these properties have good infrastructure with roads and power. However, both are low grade with resources under one gram per tonne (0.029 ounces per ton). The companies are working to further define the resources and their metallurgy (gold process/recoveries) in order to fully assess the economics.
At the eastern end of the Tombstone Belt we visited Snowline Gold’s (0.52% of Strategy net assets) Rogue property. Snowline announced the discovery of the Valley deposit in January 2022. While Snowline has yet to publish a maiden resource, drilling so far indicates that Valley is a multi-million-ounce deposit that crops out on surface. The photo shows Valley core drilled through a granodiorite intrusive that is riddled with gold-bearing sheeted quartz veins. This is classic Tombstone belt mineralization.
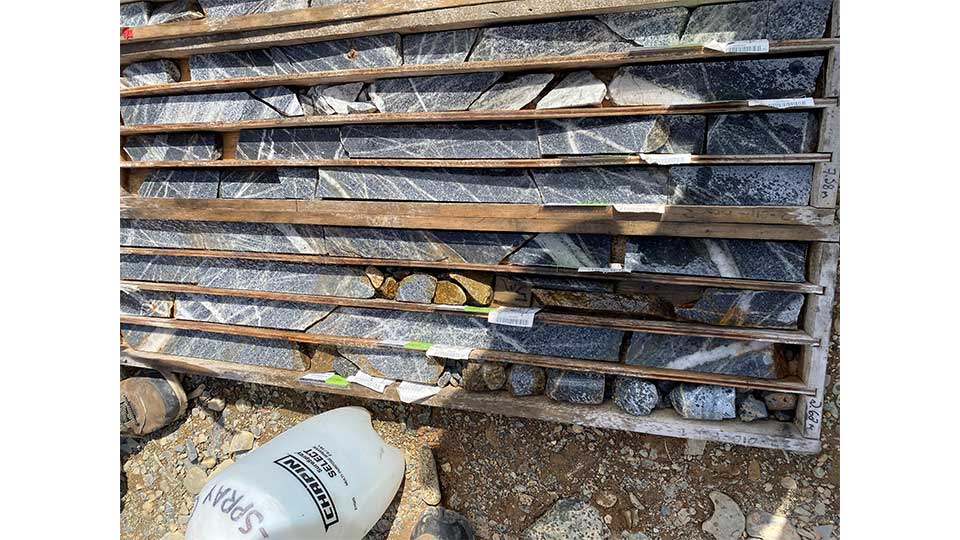
Gold-bearing core samples from Snowline’s Rogue property. Source: VanEck (June 2023).
Unlike Golden Summit and AurMac, Valley is remote. The camp is accessed by fixed wing aircraft and the Valley deposit is accessed via helicopter from there.
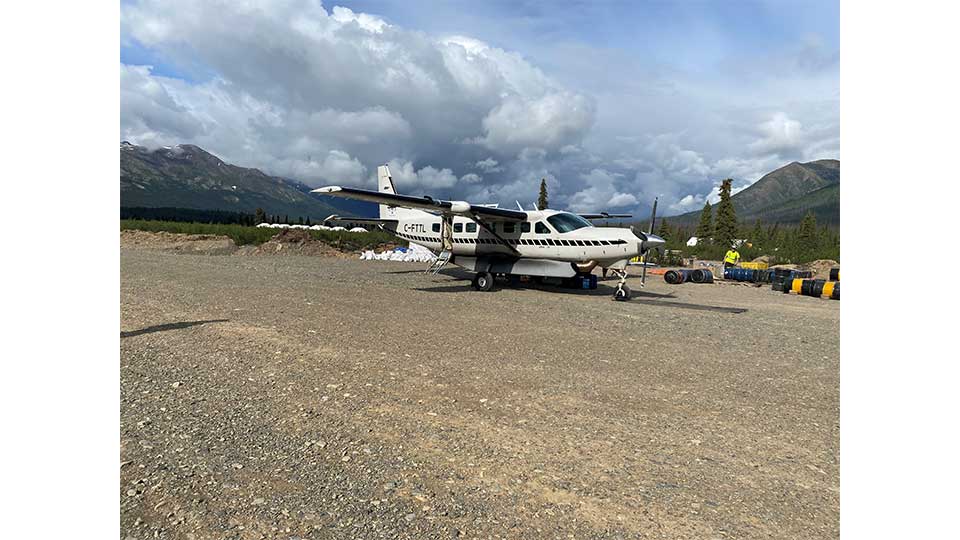
One of several small aircraft required to visit Snowline’s remote Valley deposit. Source: VanEck (June 2023).
Valley carries higher grades than most Tombstone belt deposits, but getting roads and power to the site will be a challenge. Snowline is working on the challenges while continuing to delineate Valley and explore other targets on the Rogue properties.
We reckon we walked over roughly 30 million ounces of undeveloped gold on our trip. Junior explorers and developers are the life blood of the gold industry. Explorers take the risks and developers do the work of taking a deposit from discovery to reserve and from permitting to production. Quality projects are often acquired by a larger producer along the way. Junior producer Victoria Gold (0.00% of Strategy net assets) and mid-tier producer B2Gold (4.32% of Strategy net assets) have taken strategic equity stakes in Banyan and Snowline respectively. This trip convinced us that there will surely be another major mine built along the Tombstone Belt.
i Freegold Extends Mineralization 400 Metres To The North At Golden Summit.
ii Banyan Gold increases AurMac inferred ounces by over 50%.
1The U.S. Dollar Index measures the value of the U.S. dollar relative to a basket of foreign currencies, often referred to as a basket of U.S. trade partners' currencies. 2S&P 500 Index is a market-capitalization-weighted index of 500 leading publicly traded companies in the United States. 3NASDAQ 100 Index is a modified market capitalization weighted index comprising the 100 largest, most actively-traded U.S. companies listed on the Nasdaq stock exchange. 4NYSE Arca Gold Miners Index (GDMNTR) is a modified market capitalization-weighted index comprised of publicly traded companies involved primarily in the mining for gold. 5MVIS Global Junior Gold Miners Index (MVGDXJTR) is a rules-based, modified market capitalization-weighted, float-adjusted index comprised of a global universe of publicly traded small- and medium-capitalization companies that generate at least 50% of their revenues from gold and/or silver mining, hold real property that has the potential to produce at least 50% of the company’s revenue from gold or silver mining when developed, or primarily invest in gold or silver.
Related Insights
IMPORTANT DEFINITIONS & DISCLOSURES
This material may only be used outside of the United States.
This is not an offer to buy or sell, or a recommendation of any offer to buy or sell any of the securities mentioned herein. Fund holdings will vary. For a complete list of holdings in VanEck Mutual Funds and VanEck ETFs, please visit our website at www.vaneck.com.
The information presented does not involve the rendering of personalized investment, financial, legal, or tax advice. Certain statements contained herein may constitute projections, forecasts and other forward looking statements, which do not reflect actual results. Information provided by third-party sources are believed to be reliable and have not been independently verified for accuracy or completeness and cannot be guaranteed. Any opinions, projections, forecasts, and forward-looking statements presented herein are valid as of the date of this communication and are subject to change without notice. The information herein represents the opinion of the author(s), but not necessarily those of VanEck.
The views contained herein are not to be taken as advice or a recommendation to buy or sell any investment in any jurisdiction, nor is it a commitment from Van Eck Associates Corporation or its subsidiaries to participate in any transactions in any companies mentioned herein. This content is published in the United States. Investors are subject to securities and tax regulations within their applicable jurisdictions that are not addressed herein.
All investing is subject to risk, including the possible loss of the money you invest. As with any investment strategy, there is no guarantee that investment objectives will be met and investors may lose money. Diversification does not ensure a profit or protect against a loss in a declining market. Past performance is no guarantee of future results.