China’s Economic Growth: How Is China’s Economy Doing?
03 September 2019
China has been a major contributor to global growth, and its economic activity tends to have significant repercussions for the global economy. To understand where the Chinese economy is in its growth cycle, the two charts below are perhaps the only charts one needs.
Chinese Economy Health Check: PMIs 
Source: Bloomberg. Data as of 31 August 2019. Past performance is no guarantee of future results. Chart is for illustrative purposes only
Purchasing managers’ indices (PMIs)1 are a better indicator of the health of the Chinese economy than the gross domestic product (GDP) number, which is politicized and is a composite in any case. The manufacturing and non-manufacturing, or service, PMIs have been separated in order to understand the different sectors of the economy. These days, the manufacturing PMI is the number to watch for cyclicality. The latest surveys suggest that this is not going to be an easy ride for the Chinese economy. The weakness in the manufacturing sector looks broad-based, with uncertainty around U.S.-China trade relations being the main drag. One bright spot is that small companies PMIs continue to rebound. Whether the improvement is permanent or not remains to be seen—we are mindful of likely pre-tariff frontloading (especially among exporters)—but we believe the latest figures in the following chart offers some reassurance.
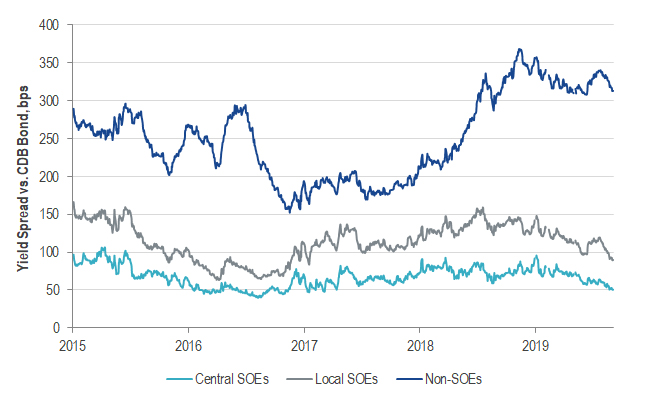
Understanding the Credit Cycle: Non-SOE Borrowing Costs
Source: UBS. Data as of 2 September 2019. Past performance is no guarantee of future results. Chart is for illustrative purposes only. Spreads are measured relative to average yield of 1, 3, 5, and 10 year bonds issued by the China Development Bank.
As with any economy, central bank policy is very important in China. In this chart, we can see that interest rates for the private sector fluctuate, whereas the interest rates paid by state-owned enterprises (SOEs) are pretty stable. Therefore, to understand the credit cycle, we point your attention to this private sector, or non-SOE, interest rate. It spiked in 2018, as a result of China’s crackdown on shadow banking2, meaning tougher lending conditions for the private sector. These interest rates began trending down in the winter of 2018 as the “drip stimulus” appeared to take effect. After a recent stint of rising funding costs for private firms, this trend has been reversed, which signals that the preferential policy moves towards the private sector are bringing results. Anecdotal evidence suggests that demand for loans is there, but the gap between potential borrowers and the money persists. Closing this gap would require meaningful structural initiatives. We believe there is scope for cautious optimism here, as authorities continue to show unwavering commitment to the liberalization of interest rates, despite the strain of the trade war.
Click here to download the Commentary PDF
DISCLOSURE
1Purchasing managers index (PMI) is an economic indicator derived from monthly surveys of private sector companies. A reading above 50 indicates expansion, and a reading below 50 indicates contraction.
2Shadow banking comprises private credit intermediation occurring outside the formal banking system.
Important Disclosure
This is a marketing communication. Please refer to the prospectus of the UCITS and to the KID before making any final investment decisions.
This information originates from VanEck (Europe) GmbH, which has been appointed as distributor of VanEck products in Europe by the Management Company VanEck Asset Management B.V., incorporated under Dutch law and registered with the Dutch Authority for the Financial Markets (AFM). VanEck (Europe) GmbH with registered address at Kreuznacher Str. 30, 60486 Frankfurt, Germany, is a financial services provider regulated by the Federal Financial Supervisory Authority in Germany (BaFin).
The information is intended only to provide general and preliminary information to investors and shall not be construed as investment, legal or tax advice VanEck (Europe) GmbH, VanEck Switzerland AG, VanEck Securities UK Limited and their associated and affiliated companies (together “VanEck”) assume no liability with regards to any investment, divestment or retention decision taken by the investor on the basis of this information. The views and opinions expressed are those of the author(s) but not necessarily those of VanEck. Opinions are current as of the publication date and are subject to change with market conditions. Certain statements contained herein may constitute projections, forecasts and other forward-looking statements, which do not reflect actual results. Information provided by third party sources is believed to be reliable and have not been independently verified for accuracy or completeness and cannot be guaranteed. Brokerage or transaction fees may apply.
All performance information is based on historical data and does not predict future returns. Investing is subject to risk, including the possible loss of principal.
No part of this material may be reproduced in any form, or referred to in any other publication, without express written permission of VanEck.
© VanEck (Europe) GmbH / VanEck Asset Management B.V.
Sign-up for our ETF newsletter
Related Insights
13 December 2024
06 August 2024
01 May 2024
12 February 2024


