Chinese Bonds Offer Yield Pickup
12 October 2020
Global bond investors have shown increasing appetite this year for Chinese bonds, particularly those denominated in local currency. They currently offer attractive yield advantage over U.S. and other developed markets bonds. Further, we believe the potential for currency appreciation, relative stability and diversification potential provide support for an allocation to Chinese domestic bonds within a global fixed income portfolio.
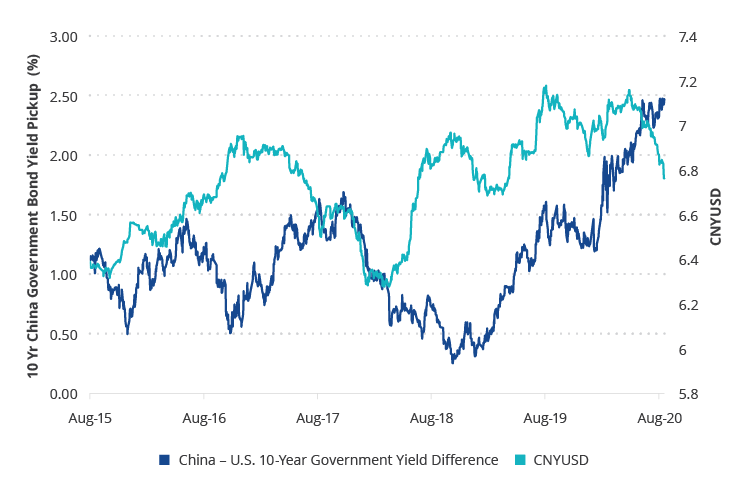
Currently, 10-year Chinese government bonds are yielding nearly 250 basis points above the 10-year U.S. Treasury, a differential that has increased sharply over the past two years.1 Local yields have increased over the past three months amid an impressive economic recovery and a muted monetary and fiscal policy response. However, the growing yield advantage has been driven primarily by the plunge in U.S. yields from over 3% to the current levels below 0.70%. This yield advantage is perhaps even more striking when considering China’s single-A credit rating and that it has the world’s second largest bond market behind only the U.S.
China Yield Pickup and FX Rate

Source: Bloomberg. Data as of 17/9/2020.
Beyond the attractive yield potential, the RMB has recently appreciated and provided additional return to investors, driven by some of the same factors behind the recent move in rates. Policymakers in China closely manage the currency’s value, which is one reason it has not historically experienced the same level of volatility of other emerging markets currencies. Further, there is a massive local investor base that can provide liquidity and funding, even in stressed periods. These attributes have made China local bonds a relatively more stable part of the emerging markets debt landscape.
With gradual inclusion in local bond indices continuing, including the ongoing addition to the J.P. Morgan GBI-EM suite of indices and recently announced inclusion in the FTSE World Government Bond Index, inflows from foreign investors are expected to continue and may reach $300 billion as passively managed funds adjust their allocations. This amount will likely be higher as actively managed portfolios also increase exposure. In addition to the yield advantage, currency appreciation potential and stability provided, we believe onshore bonds have also exhibited attractive diversification benefits. They have very low correlation to U.S. Treasuries and investment grade bonds, lower correlation to other emerging markets bonds (both local and hard currency) than U.S. high yield, and a lower correlation to U.S. equity than emerging markets bonds and U.S. high yield.2
1Source: Bloomberg. Data as of 17/9/2020.
2Source: Bloomberg. Data as of 31/8/2020. Based on 5-year monthly return correlation of the ChinaBond China High Quality Bond Index (China bonds), Bloomberg Barclays U.S. Treasury Index (U.S. Treasuries), Bloomberg Barclays U.S. Aggregate Bond Index (investment grade bonds), J.P. Morgan EMBI Global Diversified Index (hard currency emerging markets bonds), J.P. Morgan GBI-EM Global Diversified Index (local currency emerging markets bonds), ICE BofA US High Yield Index (U.S. high yield) and S&P 500 (U.S. equity).
Important Disclosure
This is a marketing communication. Please refer to the prospectus of the UCITS and to the KID before making any final investment decisions.
This information originates from VanEck (Europe) GmbH, which has been appointed as distributor of VanEck products in Europe by the Management Company VanEck Asset Management B.V., incorporated under Dutch law and registered with the Dutch Authority for the Financial Markets (AFM). VanEck (Europe) GmbH with registered address at Kreuznacher Str. 30, 60486 Frankfurt, Germany, is a financial services provider regulated by the Federal Financial Supervisory Authority in Germany (BaFin).
The information is intended only to provide general and preliminary information to investors and shall not be construed as investment, legal or tax advice VanEck (Europe) GmbH, VanEck Switzerland AG, VanEck Securities UK Limited and their associated and affiliated companies (together “VanEck”) assume no liability with regards to any investment, divestment or retention decision taken by the investor on the basis of this information. The views and opinions expressed are those of the author(s) but not necessarily those of VanEck. Opinions are current as of the publication date and are subject to change with market conditions. Certain statements contained herein may constitute projections, forecasts and other forward-looking statements, which do not reflect actual results. Information provided by third party sources is believed to be reliable and have not been independently verified for accuracy or completeness and cannot be guaranteed. Brokerage or transaction fees may apply.
All performance information is based on historical data and does not predict future returns. Investing is subject to risk, including the possible loss of principal.
No part of this material may be reproduced in any form, or referred to in any other publication, without express written permission of VanEck.
© VanEck (Europe) GmbH / VanEck Asset Management B.V.
Sign-up for our ETF newsletter
Related Insights
08 January 2025
06 August 2024
23 July 2024
05 July 2024
29 May 2024


