Hivemapper: Why We're Bullish
13 August 2023
Hivemapper's crowdsourced, crypto-based mapping could disrupt the market, with its token $HONEY's value derived from factors including market size, share, token velocity, and circulation.
Please note that VanEck may have a position(s) in the digital asset(s) described below.
Please note, VanEck has made its first side pocket investment in Hivemapper's HONEY token. This investment was made through a transaction directly with Hivemapper, Inc. Post purchase, VanEck owns less than 75 bps of the fully diluted token supply. Our investment comes with a 1 year lock up.
Hivemapper presents a unique opportunity utilizing cryptocurrency to crowdsource contributions toward building a decentralized mapping network. In the short term, Hivemapper has proven crypto is a transformative means of incentivizing a global network of actors to work toward a common goal. In the long term, Hivemapper may be able to take market share away from incumbent mapping players by offering a better, cheaper product to its clients.
Hivemapper’s goal is to create a decentralized and permissionless global map that anyone can contribute to and utilize however they want. They aim to have more global, street-level coverage than existing players while providing higher-quality data, all for a lower cost.
How it Works
Drivers worldwide can purchase and install a 4k dashcam into their vehicles to record their daily routes. In return for providing constant real-time and high-quality global map data, drivers are rewarded with $HONEY token. Additionally, if you don’t have a vehicle or the cost of the dashcam is prohibitively expensive, you can still contribute to the network as an Annotator. Annotators play a machine learning model training game, labeling traffic lights, speed limits, and other street signs. This is similar to how Google uses Captcha for ML training, except these participants get paid. They too earn $HONEY for bettering the mapping data and training the machine learning model, which will eventually be able to annotate map data itself. These contributors are crucial to the supply side of the Hivemapper ecosystem.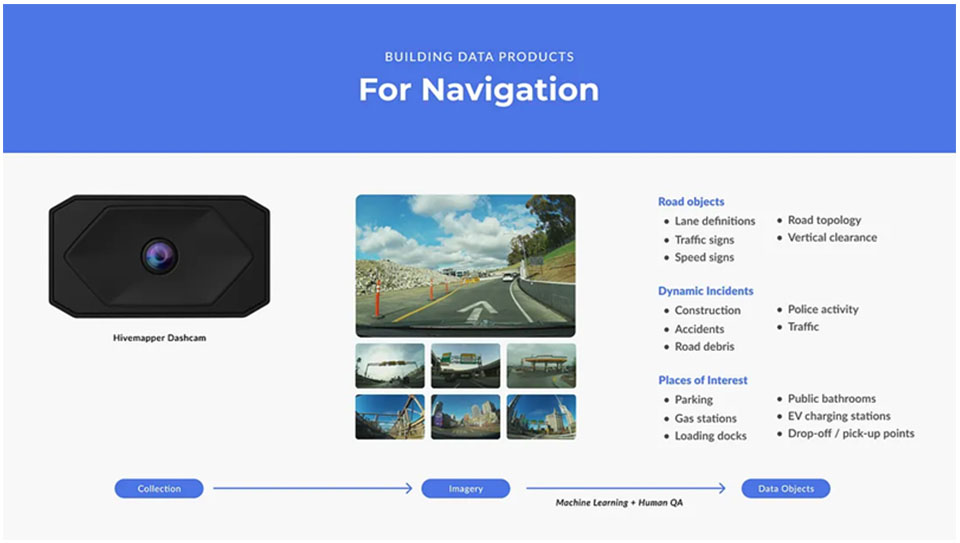
Source: Hivemapper.
The demand side network participants consist of consumers, such as enterprises or developers, who want to purchase the street-level data the Hivemapper suppliers have aggregated. Consumers who may be particularly interested in digital mapping data could include location-based service applications, logistics companies, and automotive manufacturers who require accurate navigation systems.
Interested consumers can purchase Hivemapper Map API services via Map Credits. Credits are purchased in fiat, priced at $0.02/map credit. 50 map credits provide access to 1 kilometer worth of map data. For example, if a customer wanted all of NYC’s map data, it would be 7,837,650 map credits or $156,753. After the consumer purchases map credits, $HONEY tokens are burned equal to the fiat amount of the contract. The burned tokens are then reallocated toward a new rewards pool for contributors. Under this token structure, the supply of $HONEY stays fixed at 10 billion tokens.
Source: Hivemapper.
Key Performance Indicators
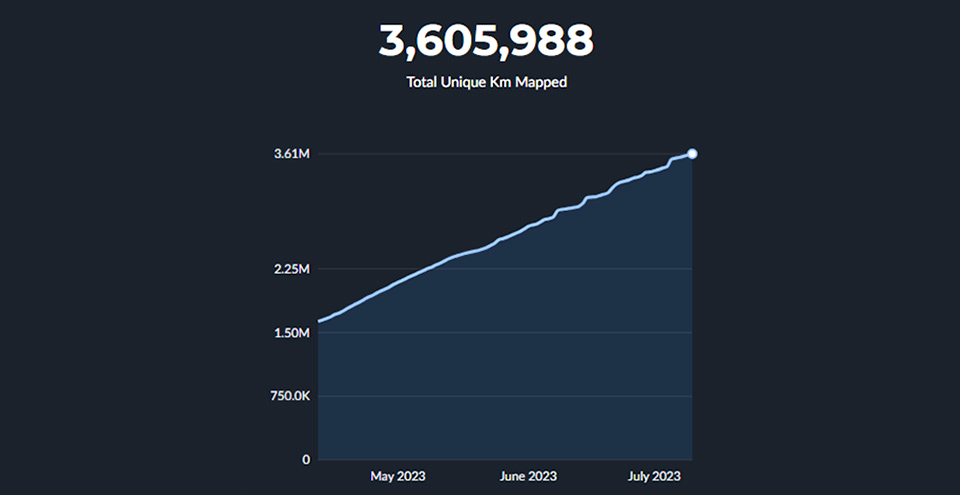
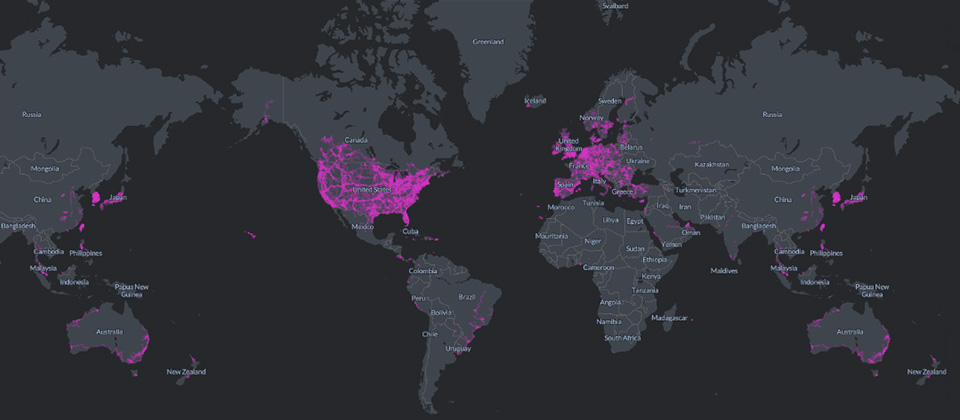
Global map coverage is the foundation upon which Hivemapper needs to build for long-term success. Hivemapper must have just as much, if not more, coverage to compete with centralized tech offerings. Since launching in November ’22, Hivemapper’s network has grown dramatically with coverage across 3.6 million unique road kilometers. For reference, . If unique road coverage continues to grow at its current pace, Hivemapper could reach 10 million km by 2024.
Source: Hivemapper.
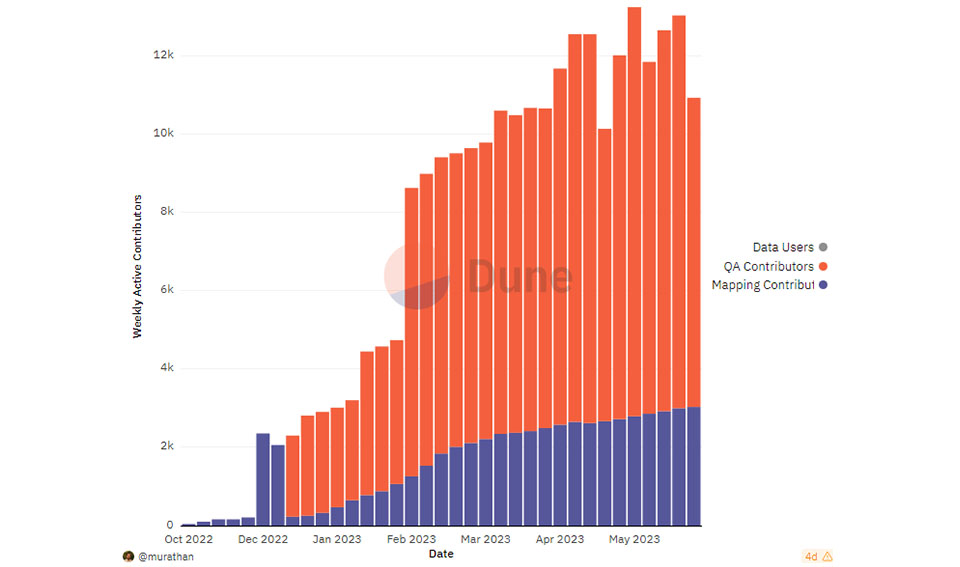
Another KPI we can observe is the total number of contributors to the network. As more contributors come aboard, they further map coverage as well as data quality and freshness, increasing value and thus demand from end clients.
Source: Dune Analytics, data as of 7/3/2023.
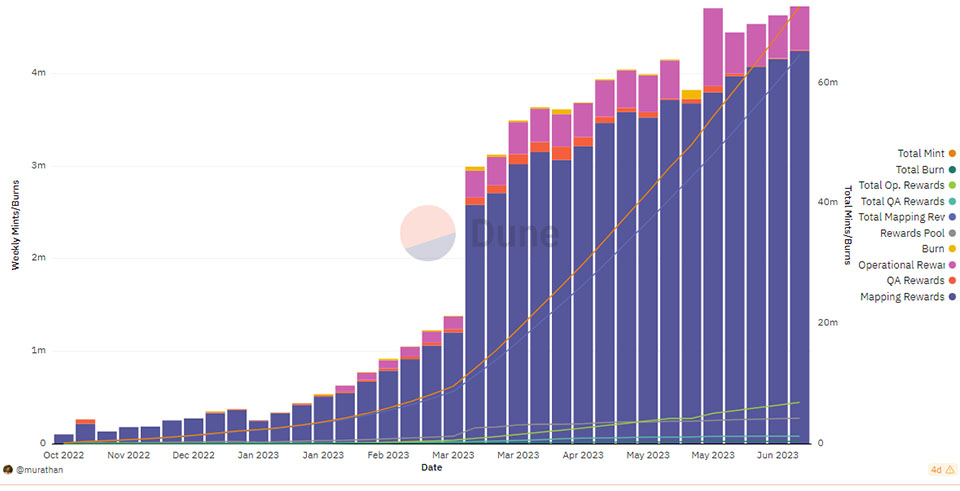
Lastly, we can track Token Burn, which provides insight into the demand for Map Credits and, thereby, a measure of Revenue generated by the network. Currently, there are significantly more tokens being newly emitted as rewards for contributing than tokens being burned for map credits. We expect that to change over time as fresher, cheaper, and broader coverage will increase demand for map credits.
Source: Dune Analytics, data as of 7/3/2023.
Key Issues Being Solved
Many issues stem from centralized tech giants’ approach to building digital mapping networks. Namely:
- Price Gouging: Existing offerings upcharge their customers because comparable alternatives largely do not exist. Many customers, especially SMEs, can .
- Maps are not up to date: Company street-view vehicles can only reach most locations on an infrequent basis. Data collection is especially sparce and outdated in emerging market areas where firms believe they will not receive as much economic benefit for providing up-to-date coverage.
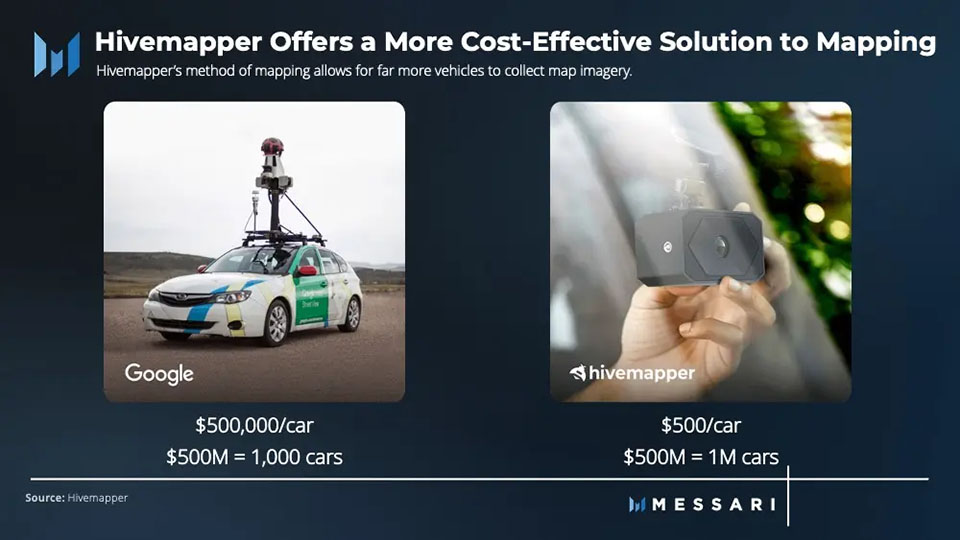
- OpEx and CapEx Heavy: Mapping the world is capital and human resource intensive. Gathering data through centralized company vehicles can cost ~$500k each to build and deploy. It is costly to gather mass coverage without deep pockets.
- Freely uses our data: Users are not compensated for data collection.
Source: Messari.
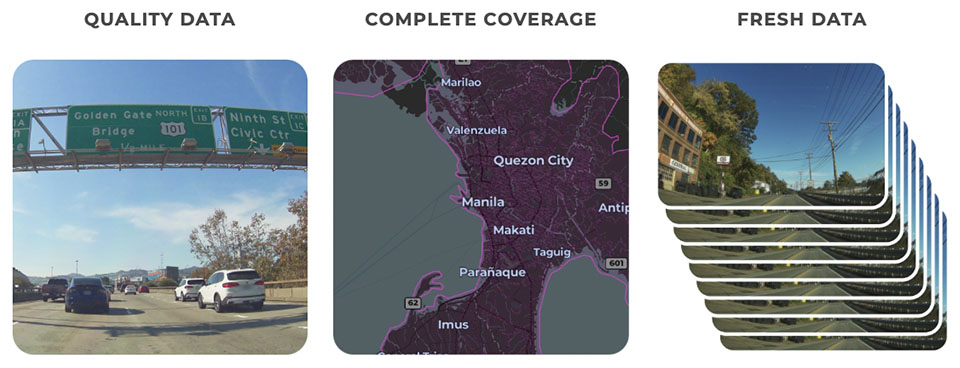
Hivemapper aims to solve these issues. The network’s costs to the end consumer are significantly cheaper because they do not have the high operational or capital expenditures to collect the mapping data. Hivemapper’s data is fresh and up to date as the global network of vehicle dashcams are constantly recording while drivers go about their normal routes. Furthermore, the $HONEY token can incentivize coverage of areas less frequently traveled. $HONEY not only incentivizes and manages behavior on the network, but it also allows for contributors to be compensated for their data as well as be financially aligned in the success of the network.
Source: Hivemapper.
Interesting Use Cases
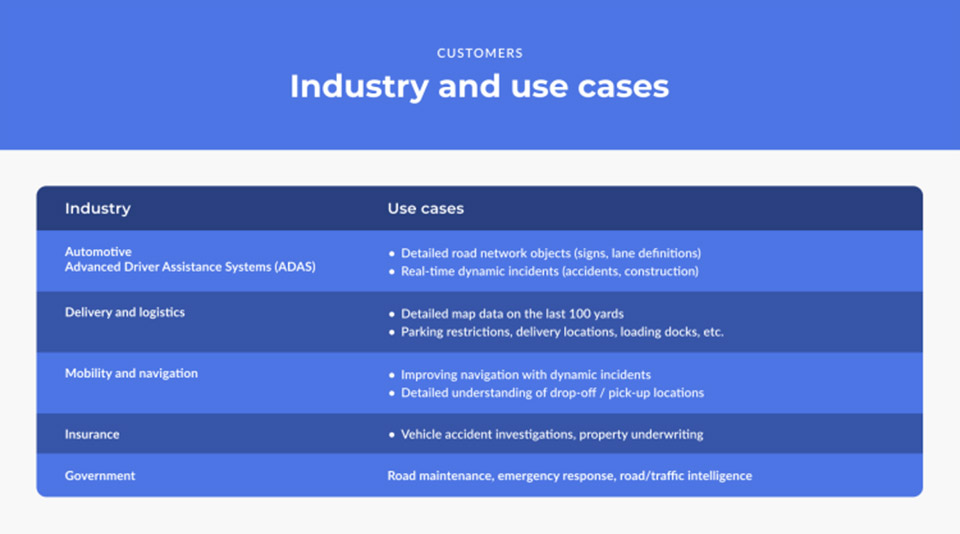
Currently, Hivemapper focuses on navigational use cases, of which there are many. Advanced Driver Assistance Systems (ADAS) are being implemented into new vehicles for high-level autonomous driving. Up-to-date mapping data is critical to the ADAS system as knowing detailed road object information such as lane definitions, debris, traffic lights, and signage is paramount.
Logistics companies may want to have visuals of loading docks and parking restrictions before delivery, as knowing can save them time and money. Governments want to know where road maintenance is necessary, have traffic intelligence, or the fastest routes available for emergency response times.
Source: Hivemapper.
HONEY Valuation Framework
Based on Hivemapper’s Burn and Mint tokenomic model, whereby $HONEY is emitted to contributors for participating in the network and $HONEY is burned as a receipt for consumer map credit purchases, we can use an framework to derive its value. The equation used is MV=PQ. M, the size of the asset base, V, the velocity of the token, and PQ, the yearly transaction value. We start by estimating the Total Addressable Market Size for the Digital Mapping Market. Then we need to estimate Hivemapper’s take rate of that market to get an implied revenue (PQ). In Hivemapper’s case, revenue is a product of map credits sold multiplied by the fiat cost of map credits. We envision Hivemapper’s data being integrated into multiple incumbent map players’ offerings as it could lead to 50%+ in cost savings for them and offer fresher, higher quality data to their customers. Due to the cost savings they could provide to their competitors and a superior product offering, we believe Hivemapper will have a considerable market share. Next, we need to estimate $HONEY’s velocity or how often the token exchanges hands each year. As a utility token in the Hivemapper ecosystem, its velocity will be greater than store-of-value assets like Bitcoin but less than a stablecoin which has no speculation over its future value. We can use an average velocity of a basket of utility tokens for this (V). Estimating $HONEY’s Revenue (PQ) and Velocity (V), we can back into its implied market cap (M). Lastly, we must estimate the number of $HONEY tokens circulating, which is a product of emissions to contributors for global map coverage progress as well as token unlocks. Dividing the market cap by the number of tokens circulating, we can come up with an implied value for $HONEY.
Key Risks
Hivemapper certainly doesn’t come without its risks and concerns. The cost of the dashcams, $299, may be prohibitively expensive for many to join on a global scale. However, this could be alleviated as third party dashcam providers come to market offering cheaper solutions. Our other concern lies in the fact that map data collection is only half the battle. The other half is marketing and sourcing clients to sell this data to. While we believe Hivemapper is on the path towards building a superior product, they must compete with the tech giants’ sales teams, who have robust pipelines and headcount. However, we envision a world in which Hivemapper’s data could be integrated into the backend of existing map players’ offerings as it can provide more real-time, street-level data and cut their costs significantly.
Source: Hivemapper.
Closing Thoughts
Hivemapper takes an interesting bottom-up approach to building a mapping infrastructure network traditionally built top-down by centralized tech players with deep pockets. By using a token incentive model, contributors are compensated for their data and are willing to continue to provide coverage to the network as they have an economic motivation to share in its success. With the potential for broader, fresher, and higher quality coverage than existing offerings and lower costs to the end clients, we believe Hivemapper will gain traction and market share over the coming years.
To receive more Digital Assets insights, subscribe for our Crypto Newsletter
Important Information
This is not financial research but the opinion of the author of the article. We publish this information to inform and educate about recent market developments and technological updates, not to give any recommendation for certain products or projects. The selection of articles should therefore not be understood as financial advice or recommendation for any specific product and/or digital asset. We may occasionally include analysis of past market, network performance expectations and/or on-chain performance. Historical performance is not indicative for future returns.
For informational and advertising purposes only.
This information originates from VanEck (Europe) GmbH, Kreuznacher Straße 30, 60486 Frankfurt am Main. It is intended only to provide general and preliminary information to investors and shall not be construed as investment, legal or tax advice. VanEck (Europe) GmbH and its associated and affiliated companies (together “VanEck”) assume no liability with regards to any investment, divestment or retention decision taken by the investor on the basis of this information. Views and opinions expressed are current as of the date of this information and are subject to change with market conditions. Certain statements contained herein may constitute projections, forecasts and other forward looking statements, which do not reflect actual results. VanEck makes no representation or warranty, express or implied regarding the advisability of investing in securities or digital assets generally or in the product mentioned in this information (the “Product”) or the ability of the underlying Index to track the performance of the relevant digital assets market.
The underlying Index is the exclusive property of MarketVector Indexes GmbH, which has contracted with CryptoCompare Data Limited to maintain and calculate the Index. CryptoCompare Data Limited uses its best efforts to ensure that the Index is calculated correctly. Irrespective of its obligations towards the MarketVector Indexes GmbH, CryptoCompare Data Limited has no obligation to point out errors in the Index to third parties.
Investing is subject to risk, including the possible loss of principal up to the entire invested amount and the extreme volatility that ETNs experience. You must read the prospectus and KID before investing, in order to fully understand the potential risks and rewards associated with the decision to invest in the Product. The approved Prospectus is available at www.vaneck.com . Please note that the approval of the prospectus should not be understood as an endorsement of the Products offered or admitted to trading on a regulated market.
Performance quoted represents past performance, which is no guarantee of future results and which may be lower or higher than current performance.
Current performance may be lower or higher than average annual returns shown. Performance shows 12 month performance to the most recent Quarter end for each of the last 5yrs where available. E.g. '1st year' shows the most recent of these 12-month periods and '2nd year' shows the previous 12 month period and so on. Performance data is displayed in Base Currency terms, with net income reinvested, net of fees. Brokerage or transaction fees will apply. Investment return and the principal value of an investment will fluctuate. Notes may be worth more or less than their original cost when redeemed.
Index returns are not ETN returns and do not reflect any management fees or brokerage expenses. An index’s performance is not illustrative of the ETN’s performance. Investors cannot invest directly in the Index. Indices are not securities in which investments can be made.
No part of this material may be reproduced in any form, or referred to in any other publication, without express written permission of VanEck.
© VanEck (Europe) GmbH
Important Disclosure
This is a marketing communication. Please refer to the prospectus of the UCITS and to the KID before making any final investment decisions.
This information originates from VanEck (Europe) GmbH, which has been appointed as distributor of VanEck products in Europe by the Management Company VanEck Asset Management B.V., incorporated under Dutch law and registered with the Dutch Authority for the Financial Markets (AFM). VanEck (Europe) GmbH with registered address at Kreuznacher Str. 30, 60486 Frankfurt, Germany, is a financial services provider regulated by the Federal Financial Supervisory Authority in Germany (BaFin).
The information is intended only to provide general and preliminary information to investors and shall not be construed as investment, legal or tax advice VanEck (Europe) GmbH, VanEck Switzerland AG, VanEck Securities UK Limited and their associated and affiliated companies (together “VanEck”) assume no liability with regards to any investment, divestment or retention decision taken by the investor on the basis of this information. The views and opinions expressed are those of the author(s) but not necessarily those of VanEck. Opinions are current as of the publication date and are subject to change with market conditions. Certain statements contained herein may constitute projections, forecasts and other forward-looking statements, which do not reflect actual results. Information provided by third party sources is believed to be reliable and have not been independently verified for accuracy or completeness and cannot be guaranteed. Brokerage or transaction fees may apply.
All performance information is based on historical data and does not predict future returns. Investing is subject to risk, including the possible loss of principal.
No part of this material may be reproduced in any form, or referred to in any other publication, without express written permission of VanEck.
© VanEck (Europe) GmbH / VanEck Asset Management B.V.
Sign-up for our ETF newsletter
Related Insights
Related Insights
11 October 2024
10 October 2024
27 November 2024
11 October 2024
11 October 2024
10 October 2024


