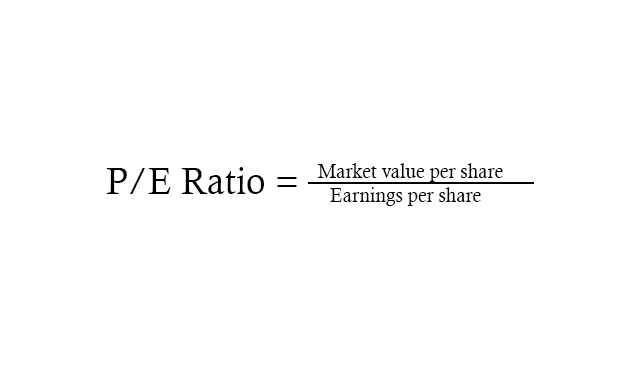
A fund's price/earnings (P/E) ratio can serve as an indicator of its investment strategy and orientation—whether it leans towards value or growth—in the current market environment Industries experiencing a surge in popularity often have high P/E ratios indicative of a growth focus, whereas more traditional sectors usually feature low P/E ratios, signifying a value focus.
The P/E ratio provides a quick snapshot of a company's valuation by comparing its current stock price to its earnings1, helping investors gauge whether the stock is overvalued or undervalued relative to its peers. It also reflects market expectations for future growth, making it a fundamental tool for making informed investment decisions.
1 Company's net profit after all expenses, taxes, and costs have been deducted, which is also known as the net income. This figure is reported on the company's income statemen over a specific period, usually a quarter or a fiscal year.

P/E – Interpretation
It’s hard to find an absolute benchmark of what a “good” P/E ratio is because it varies by industry, economic conditions, growth expectations, company life cycle, earnings volatility, market sentiment, inflation rates, and interest rates, requiring comparisons to industry averages, historical P/E ratios, and the broader market to gain better insights.
Therefore, it's important to also consider other metrics to get a comprehensive evaluation of an investment's potential.