A Time of Tariffs Highlights the Wisdom of Diversification
12 March 2025
I am a supporter of free trade, happy to live in a globalized world where trade is more international than ever. Personally, I believe the growth of trade between nations has played a strong part in the greater prosperity enjoyed by today’s generation.
Unfortunately, though, America is moving towards a time of protectionism. Already, that has led to the gains that U.S. equities had made since the presidential election last November unwinding. Some market analysts also question whether the theme of American exceptionalism, often represented by the success of US companies, particularly in the tech sector, has been overstated.
Against this backdrop, the case for diversification in investment portfolios is getting louder. Traditional market capitalization-weighted indices have become dangerously concentrated in U.S. equities in general and the ‘magnificent 7’ tech stocks especially. Might it be prudent to opt for more diversified, equal-weighted indices instead?
Going back in Time: Historic Development of Tariffs
Fears about tariffs are well founded. There’s consensus among economists that protectionism harms economic growth and stability. For instance, a study using data from the IMF Research Department showed the negative effect of tariffs on countries’ output growth over the 50 years from 1963 to 2014. The charts below show how tariffs have fallen in the period and the negative average impact of tariffs on output in 151 countries.
Tariffs Decline Over Time (%)
Note: Tariff data is based on product-level data aggregated by country, with weights determined by each product's import share. Tariffs are averaged across income groups, with AM = advanced economies, EM = emerging economies, and LIC = low-income developing countries.
Source: “Are tariffs bad for growth?”. 2020. Data compiled by IMF Research Department with underlying sources: WITS, WDI, WTO, GATT, BTN.
The Effect of Tariffs on Output Growth (%)
Years After Tariff Increase
Note: Annual output growth after tariff hikes (percent), averaged across countries with significant tariff increases. (greater than one-third standard deviation, or a 3.6 percentage point change)
Source: “Are tariffs bad for growth?”. 2020. Data compiled by IMF Research Department with underlying sources: WITS, WDI, WTO, GATT, BTN.
Excessive Concentration
I would not say that U.S. stocks are riding for a fall. Just that the lurch towards protectionism at a time when they are highly valued is a reminder of the risks. The MSCI World Index currently has more than three quarters (75%) of its value in North America. Investors from around the world have a lot of their wealth tied up there, especially in the ‘magnificent seven’ tech stocks that have been leading the AI revolution.
To my mind, the concentration of wealth in U.S. equities is one of the greatest risks facing investors today. Given these developments, investors may consider diversifying their portfolios to manage risk and reduce over exposure.
Regional Exposure in World Indices (%)
Country Revenue Exposure MSCI World Index (%)
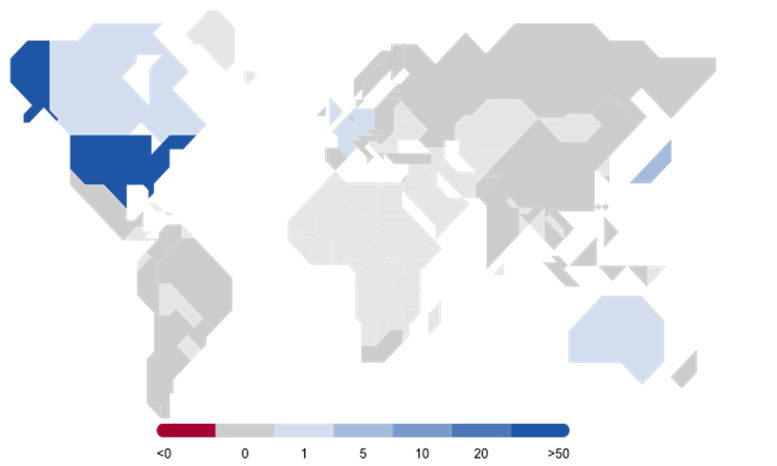
Source: Morningstar Data as of 2025-02-28. It is not possible to invest directly in an index.
Has American Exceptionalism been Overstated?
Just to reinforce the case for diversification – once described by Nobel Prize winner Harry Markowitz as the “only free lunch” in investment – the performance of equities over the past volatile months has run counter to what was expected.1 At the time of last year’s presidential election, U.S. equities were widely expected to outperform.
Yet, as the chart below shows, it’s Europe that has outperformed in the last three months. Not only has Germany’s recent election prompted expectation of a fiscal stimulus but also the European Central Bank is thought to have more scope for interest rate cuts than the US Federal Reserve.
Regional Return Comparison: Last 3 Months – Solactive Sustainable World Equity Index vs. MSCI World Index
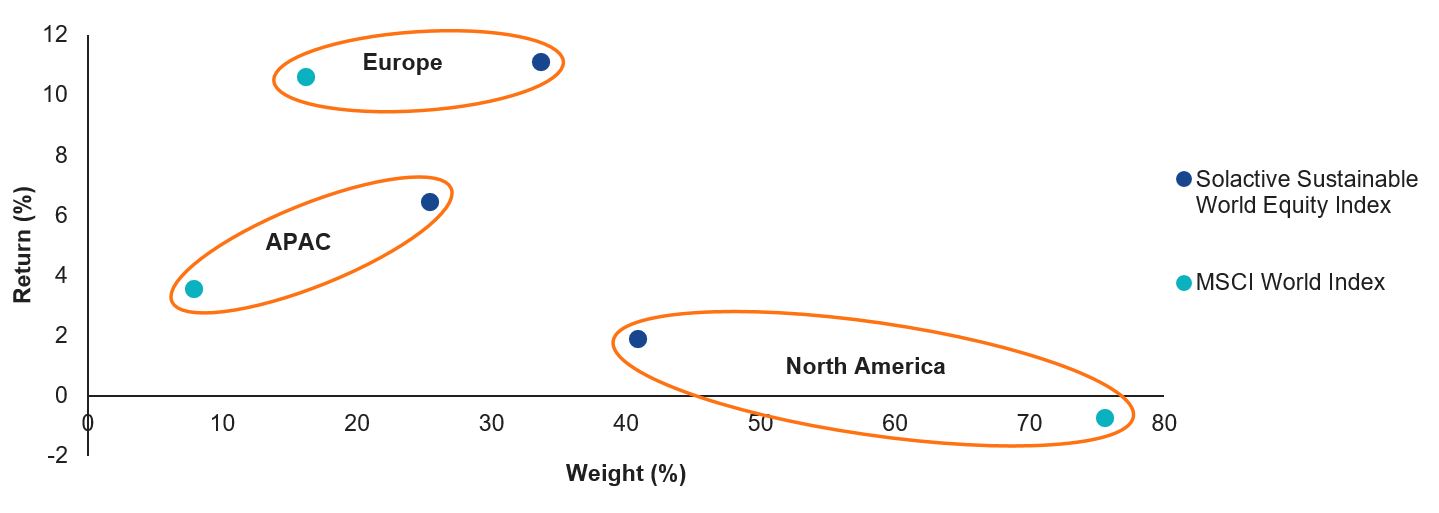
Source: Morningstar, Data period from: 2024-11-30 to 2025-02-28, Total Return in Euro. Past performance does not indicate future performance. It is not possible to invest directly in an index.
More broadly, though, the surprises of early 2025 highlight the difficulty of predicting markets – and the wisdom of being diversified in case the unexpected happens.
1 Source: The Journal of Finance . 1952.
Important Disclosure
This is a marketing communication. Please refer to the prospectus of the UCITS and to the KID before making any final investment decisions.
This information originates from VanEck (Europe) GmbH, which has been appointed as distributor of VanEck products in Europe by the Management Company VanEck Asset Management B.V., incorporated under Dutch law and registered with the Dutch Authority for the Financial Markets (AFM). VanEck (Europe) GmbH with registered address at Kreuznacher Str. 30, 60486 Frankfurt, Germany, is a financial services provider regulated by the Federal Financial Supervisory Authority in Germany (BaFin).
The information is intended only to provide general and preliminary information to investors and shall not be construed as investment, legal or tax advice VanEck (Europe) GmbH, VanEck Switzerland AG, VanEck Securities UK Limited and their associated and affiliated companies (together “VanEck”) assume no liability with regards to any investment, divestment or retention decision taken by the investor on the basis of this information. The views and opinions expressed are those of the author(s) but not necessarily those of VanEck. Opinions are current as of the publication date and are subject to change with market conditions. Certain statements contained herein may constitute projections, forecasts and other forward-looking statements, which do not reflect actual results. Information provided by third party sources is believed to be reliable and have not been independently verified for accuracy or completeness and cannot be guaranteed. Brokerage or transaction fees may apply.
All performance information is based on historical data and does not predict future returns. Investing is subject to risk, including the possible loss of principal.
No part of this material may be reproduced in any form, or referred to in any other publication, without express written permission of VanEck.
© VanEck (Europe) GmbH / VanEck Asset Management B.V.
Related Insights

Related Insights

07 March 2025

07 February 2025


07 March 2025
07 February 2025